Access and TradingView installation
Choose a free trial or paid plan, then add the invite-only indicator to a chart
Free 30-day trial
Sign in, open the ORB VX product page, enter the exact TradingView username, and submit the trial request. No card and no automatic renewal.
Request trialPaid access: 30 / 90 / 365 days
Choose a one-time plan, add it to the cart, sign in, enter the exact TradingView username, and pay through Stripe. Access time starts only after Gumrai grants the invite.
View access plansWait for the access-ready email and confirm the username shown in My Indicators.
Open TradingView → Indicators, metrics and strategies → Invite-only Scripts, then select GUMORBVX.
Open the supported XAUUSD chart and choose the timeframe you can actively monitor.
Open Settings and confirm Dashboard, current MAIN / ADD 1 plans, price tags, and alert groups.
Create one alert per timeframe using “Any alert() function call”.
Begin with Paper Trading. This Pine indicator never places MT4/MT5 orders for you.
TradingView invite-only access is granted by the script author to the submitted username. A TradingView subscription by itself does not include access to GUMRAI ORB VX.
Know the screen
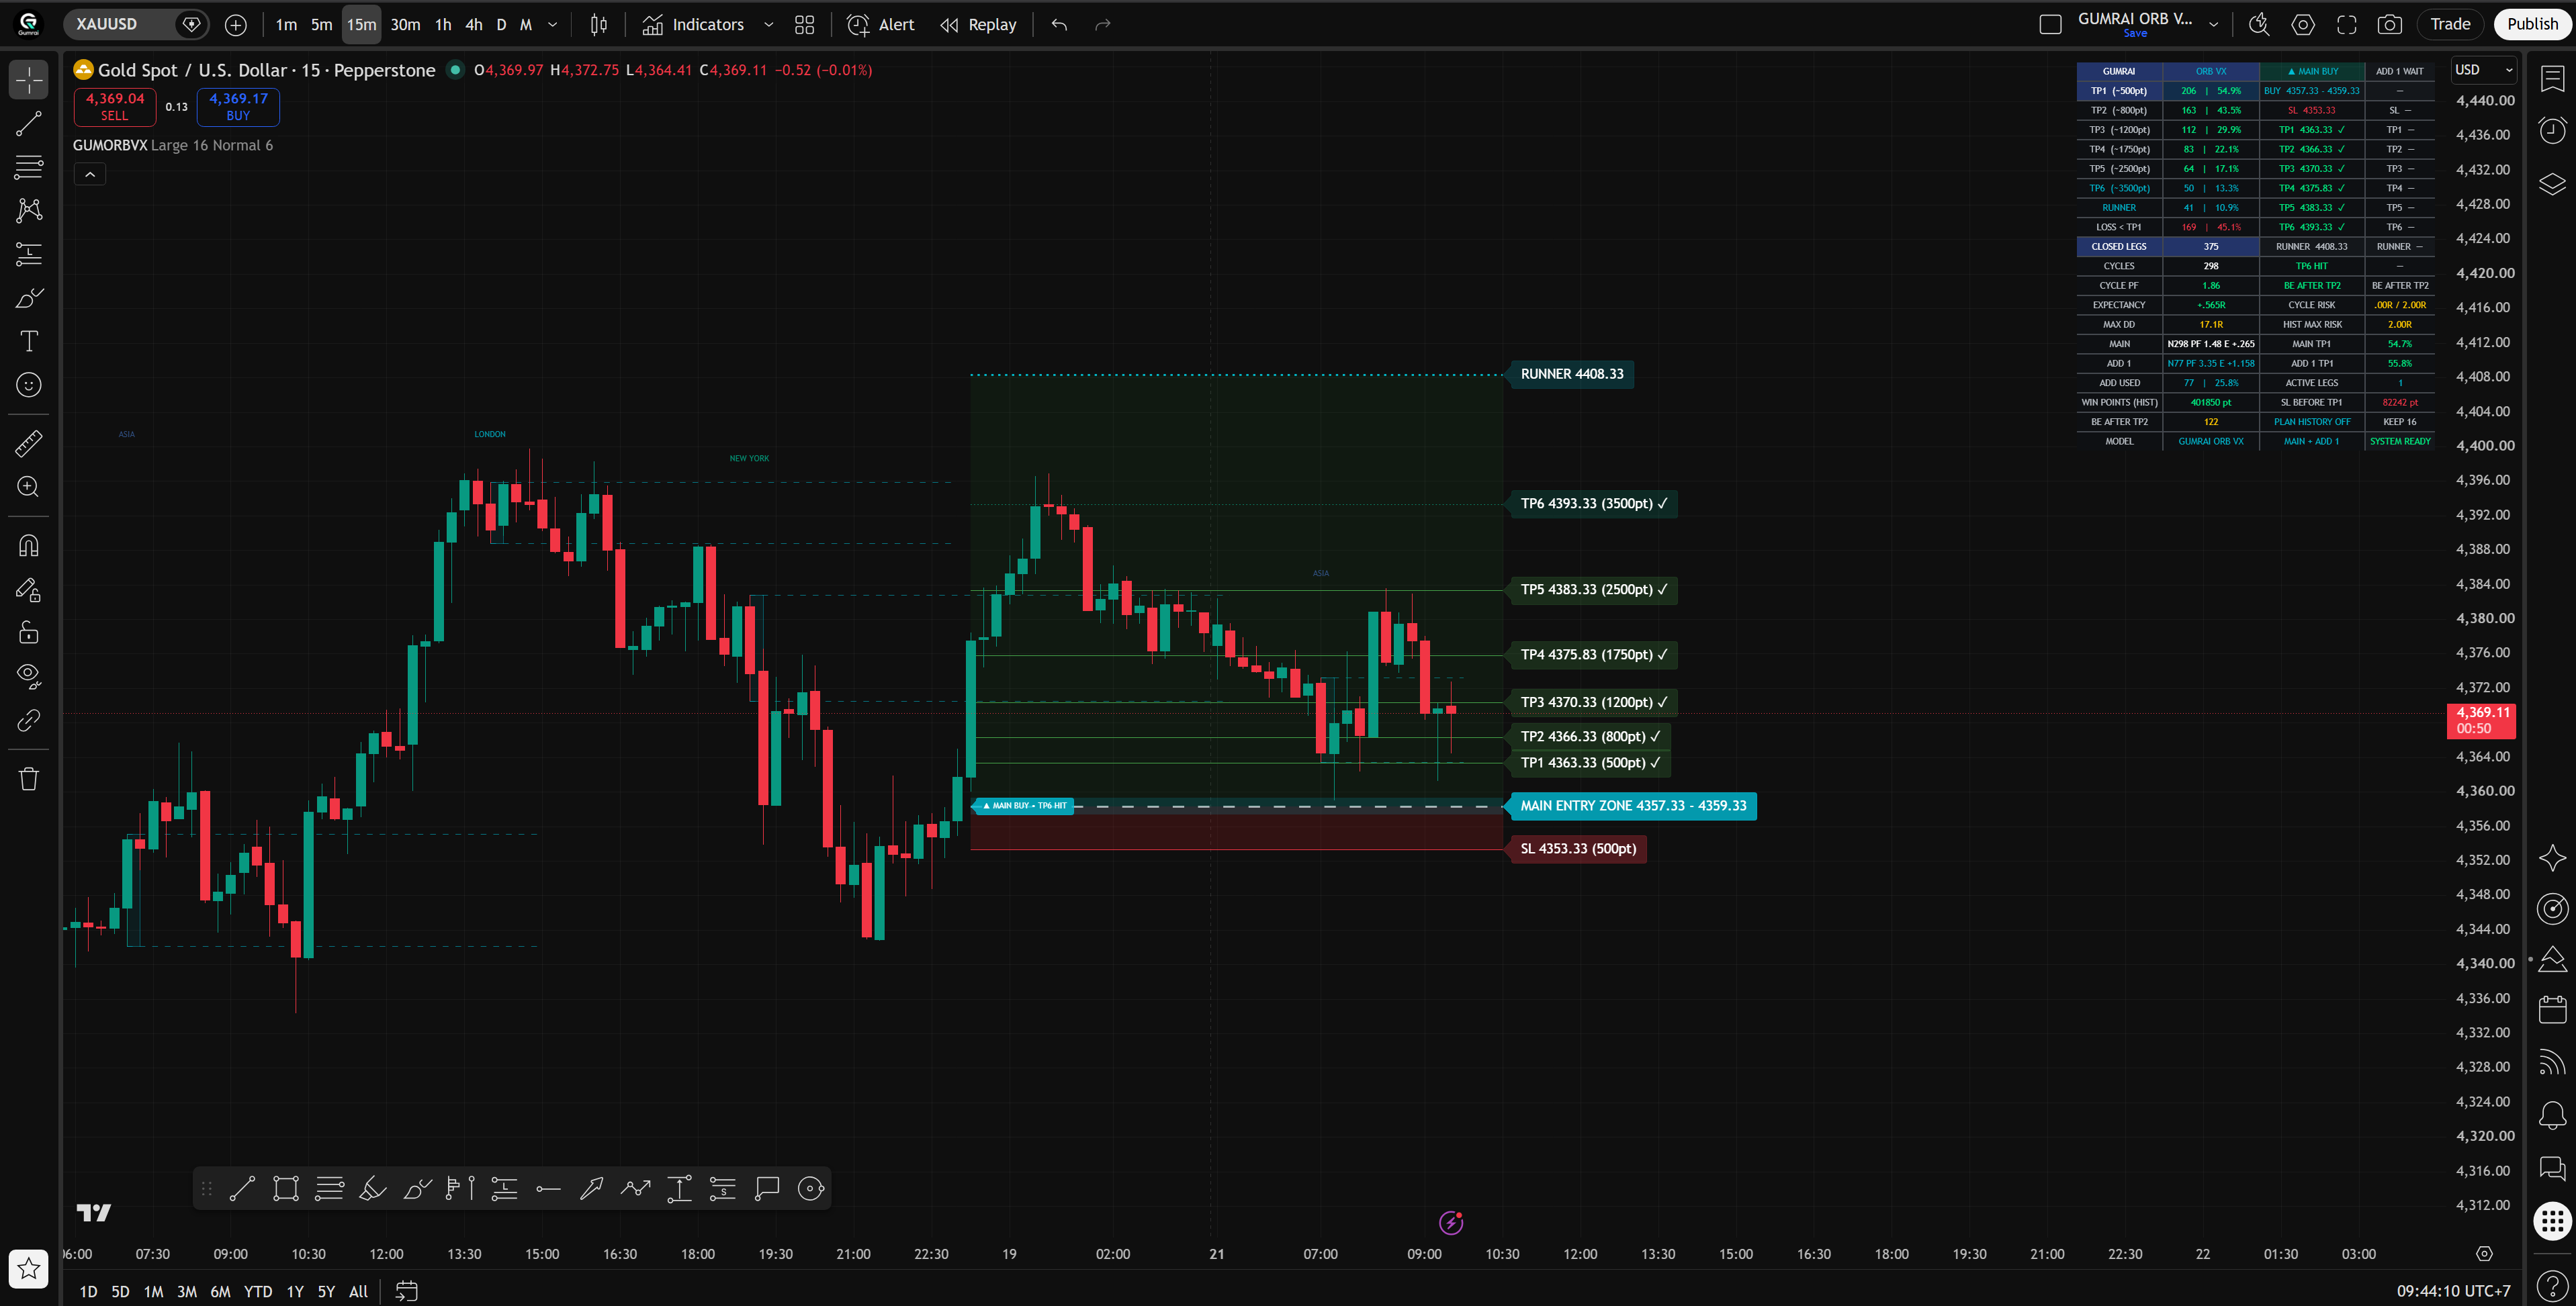
Read MAIN / ADD 1, Entry Zone, System SL, targets, and the dashboard
MAIN / ADD 1
The arrow and BUY/SELL text identify the direction and leg. MAIN is primary; ADD 1 is a separate conditional add-on.
Entry Zone
A price area to monitor—not an automatic order and not proof that every viewer received the same fill.
TP1–TP6 / RUNNER
Six fixed checkpoints plus a farther Runner level. A check mark means chart price reached that level.
System SL
The invalidation level used by the plan. Calculate your own monetary risk from your actual entry.
Dashboard
Shows the current plan on the right and historical model-plan observations on the left.
Alerts
Reports NEW MAIN, ADD 1, TP1–TP6, Runner, BE, and SL events. It does not place a broker order.
Preparing and entry confirmed are separate states
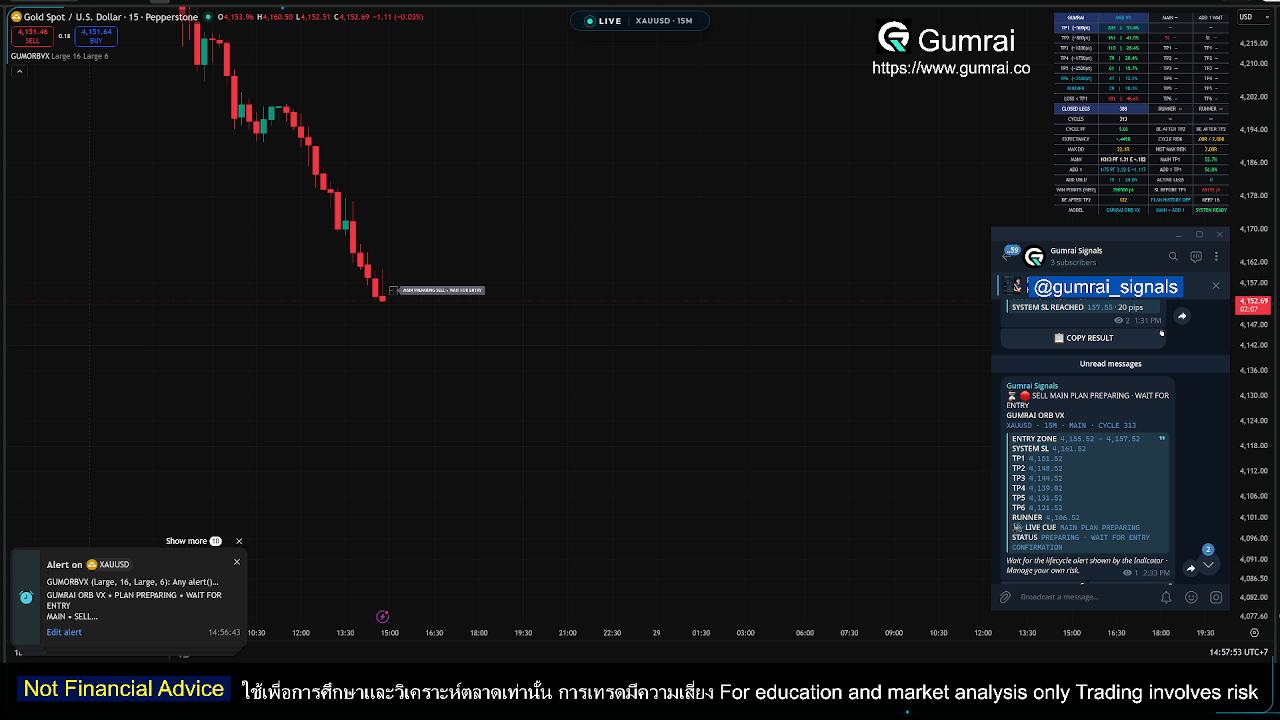
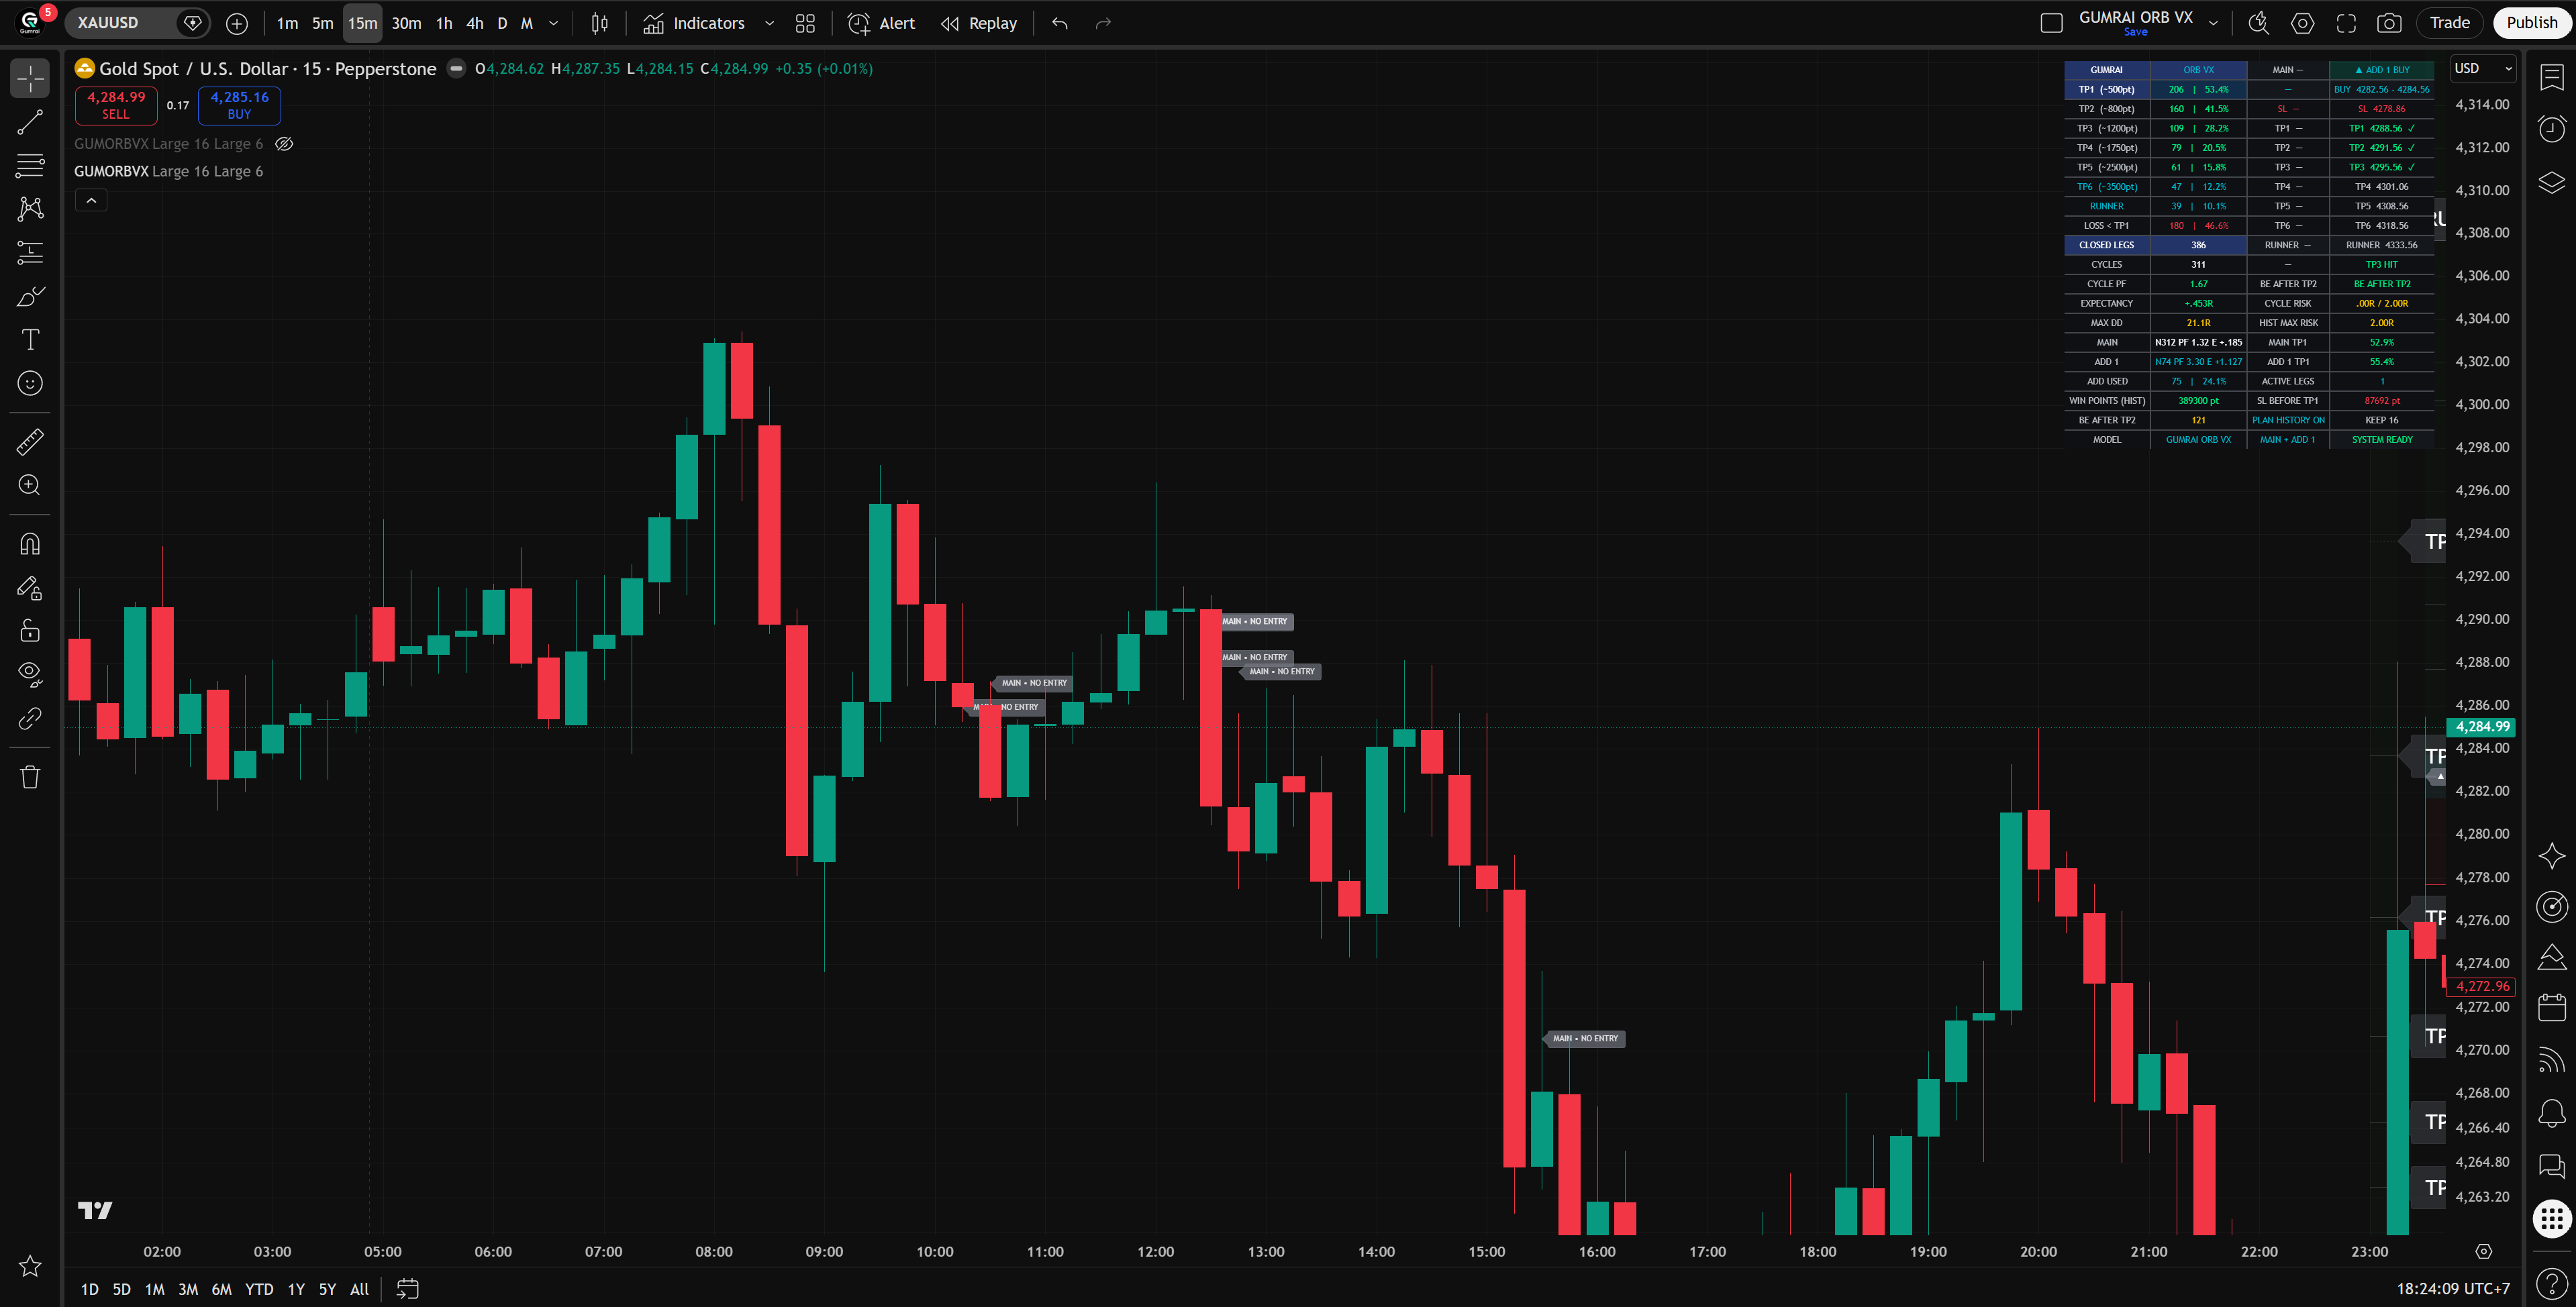
A gray plan means the setup is still preparing. Wait for the separate entry-confirmed alert before treating it as active. If confirmation fails, the levels disappear and only a small gray NO ENTRY tag remains.
 Open full-size image
The life of a plan
Understand when a plan starts, changes state, and closes
Gray plan prepares
Entry is confirmed
TP1–TP6 progress
BE after TP2 or SL
Runner or leg closes
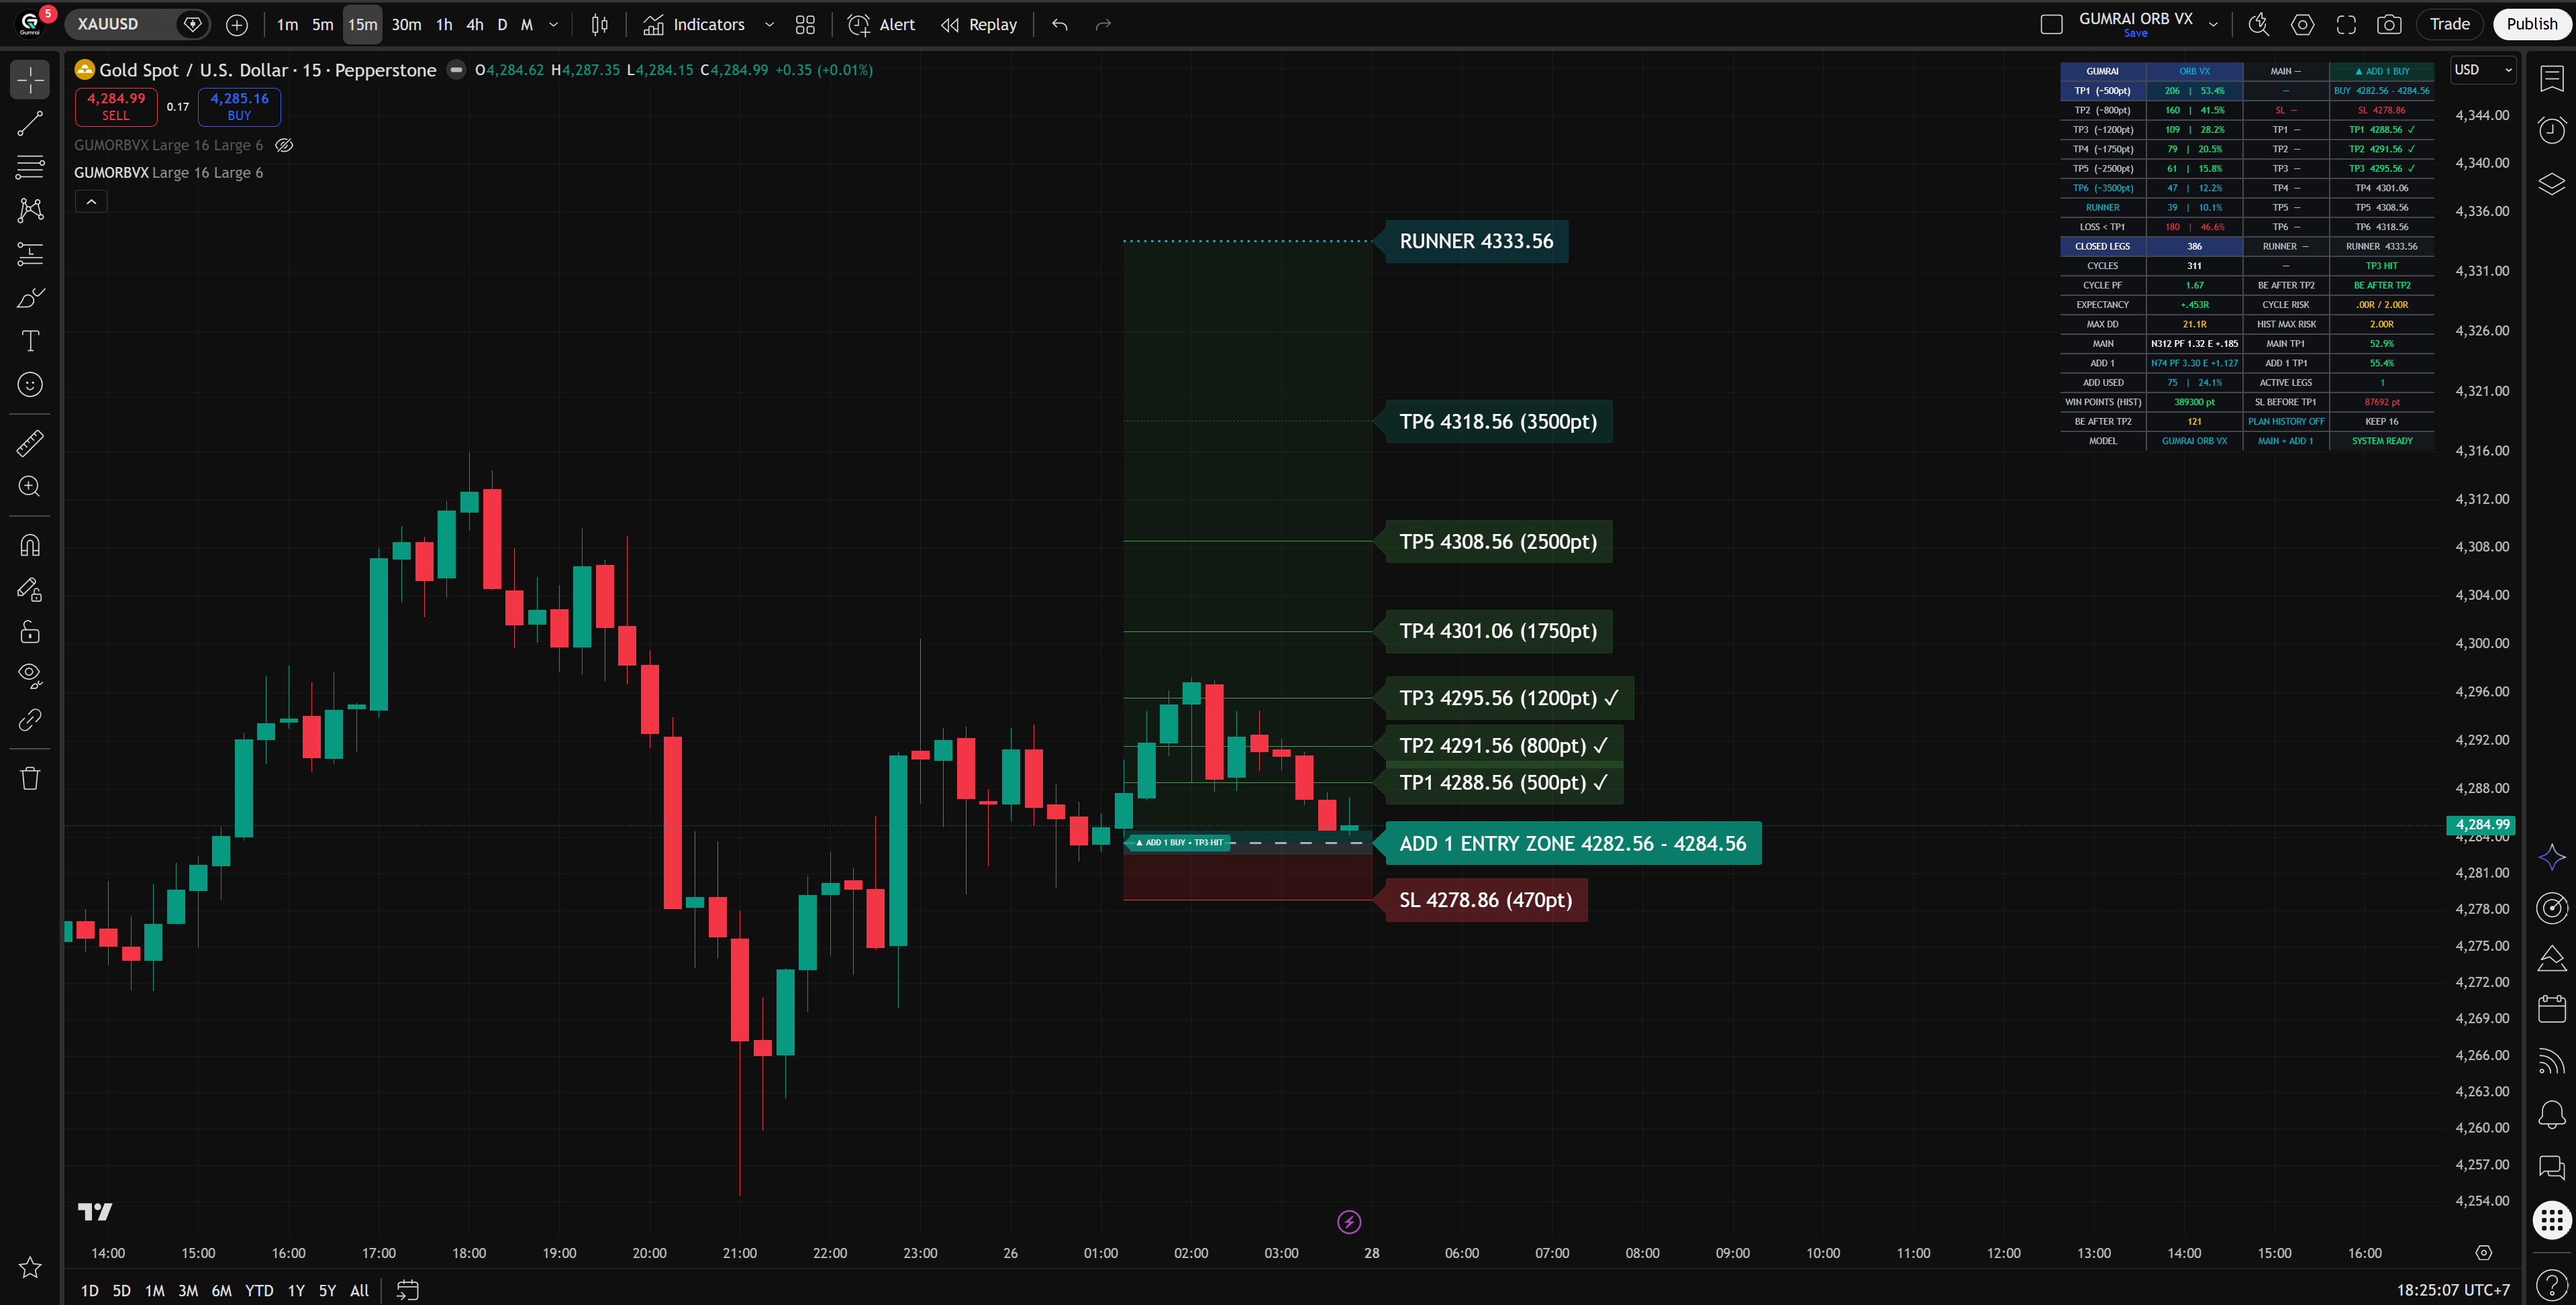
PREPARING is a short live-only state while the system waits for confirmation. The live capture below shows this gray waiting state. It can then collapse into NO ENTRY if confirmation fails, or become a full colored plan after entry confirmation.
 Open full-size image
 Open full-size image
 Open full-size image
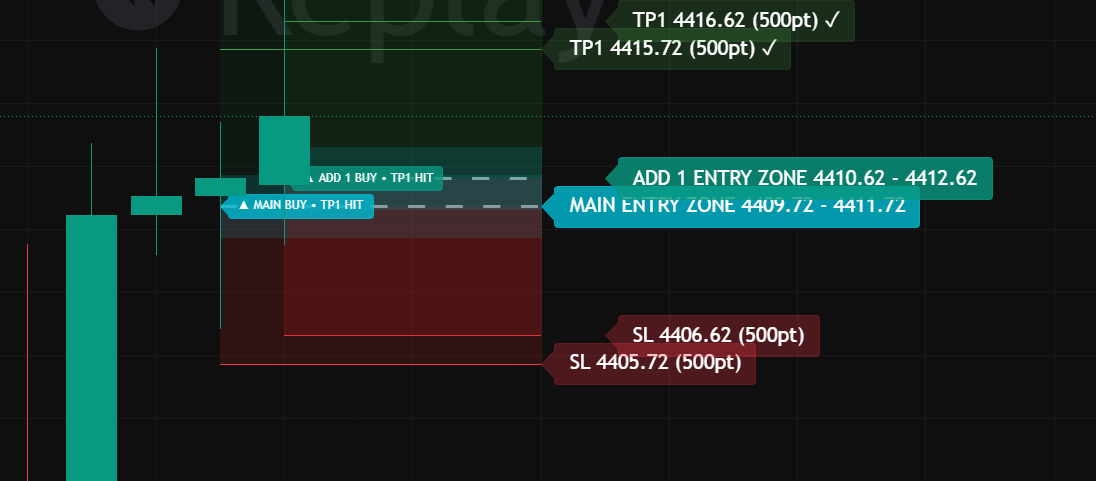
Entry Zone and System SL
Separate the planned price area from your actual fill
Treat Entry Zone as the model’s visible working range. The gray state is preparation only; the colored state begins after entry confirmation. The center line remains the plan reference, so a different execution price changes the monetary distance to System SL and every target.
 Open full-size image
Managing overlapping MAIN and ADD 1
Keep each leg’s Entry Zone, System SL, and risk separate
MAIN
The primary leg. Read its own MAIN Entry Zone and MAIN System SL. Your real fill may differ from the label, so calculate monetary risk from your actual MT4/MT5 order.
ADD 1
A separate add-on leg that can appear while MAIN is still active. It has its own Entry Zone and System SL and must not be treated as a free or riskless increase.
When MAIN and ADD 1 overlap
- Track them as two legs; each leg keeps the Entry Zone and System SL shown beside its own label.
- If you place both orders manually, attach and manage each SL separately in MT4/MT5.
- Combined account risk = MAIN risk + ADD 1 risk. Reduce lot size or skip ADD 1 if the total exceeds your limit.
- Do not widen either System SL to make two orders share one farther stop. A wider stop changes the plan risk.
Open full-size image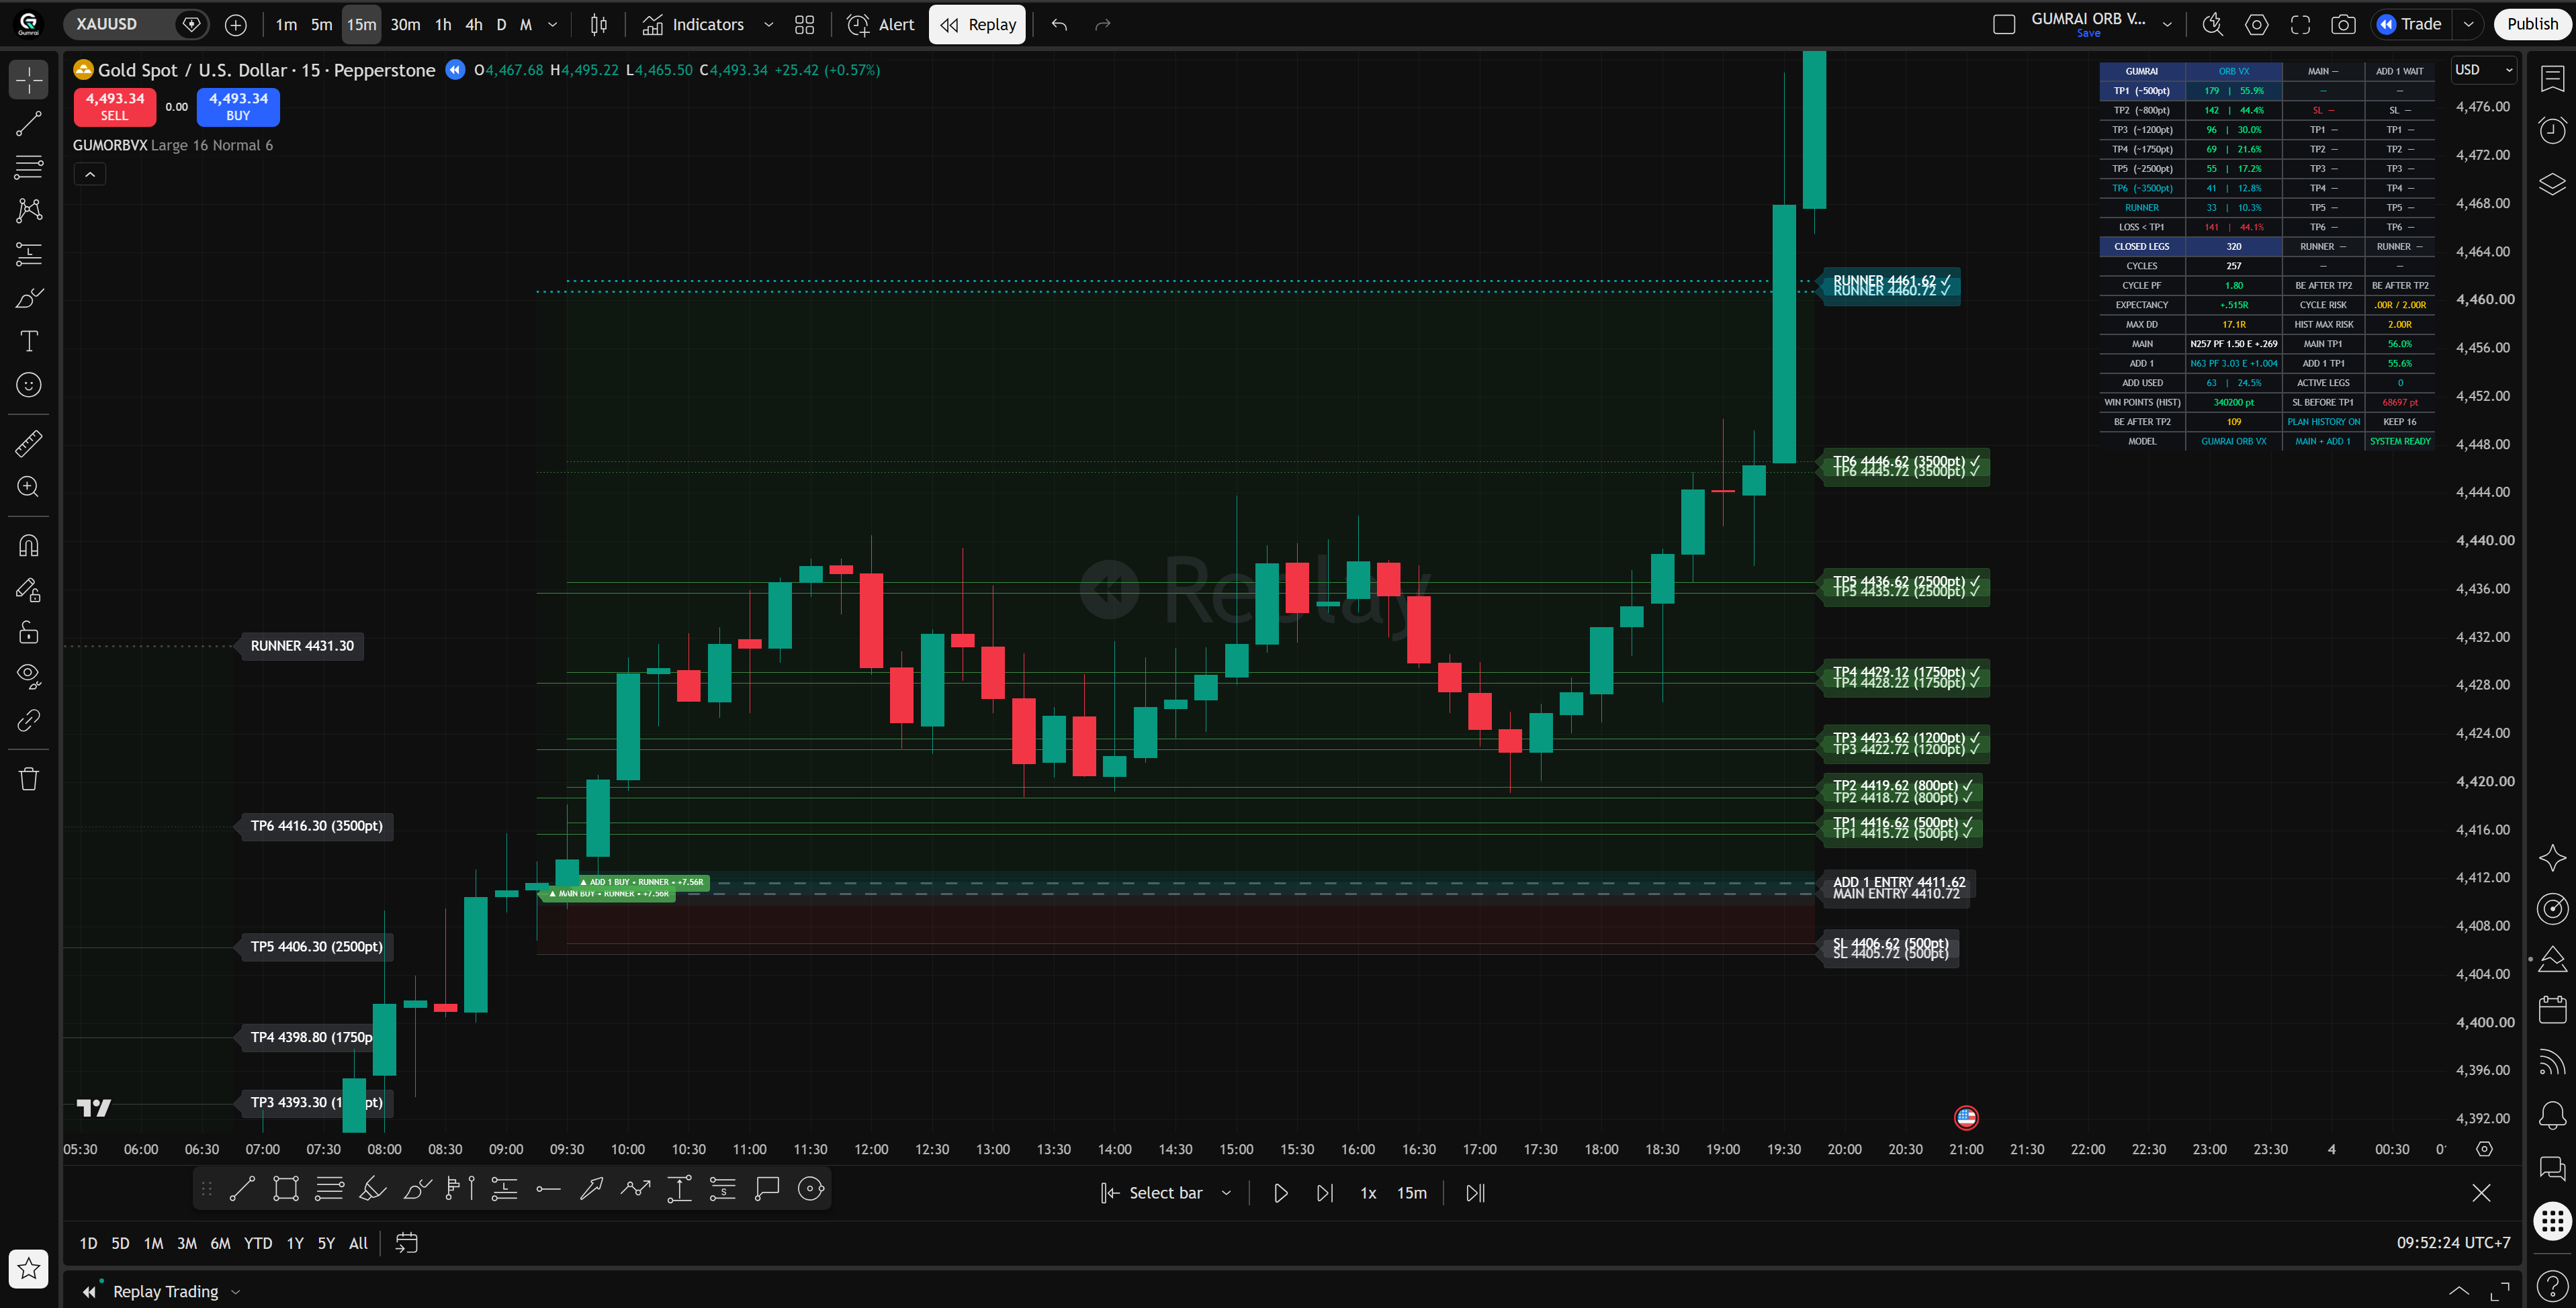 Open full-size image
TP1–TP6, Runner, and staged exits
Read the target ladder and an educational scale-out / BE framework
Every target is a chart-plan reference, not a command or guarantee. Actual MT4/MT5 fills, spread, slippage, and lot size can change the result.
ORB VX model scale-out assumptions
These percentages explain dashboard PF, expectancy, and drawdown calculations. They are not personalized trade advice. Test the same rules in Paper Trading before considering live use.
When to consider break-even
The dashboard state is BE AFTER TP2. For manual orders, wait until the relevant MAIN or ADD 1 leg has actually confirmed TP2, then account for spread/commission before moving protection toward the actual entry. Moving to the label price can still lock a loss if your real fill was worse.
Never increase risk after entry
Do not move a System SL farther away, average into a losing plan without a new ADD 1 signal, or treat an unreached target as guaranteed. If combined MAIN + ADD 1 risk exceeds your limit, reduce size or skip the add-on.
Every signal tag and plan state
Read Entry, TP, Runner, BE, SL, and per-leg result labels
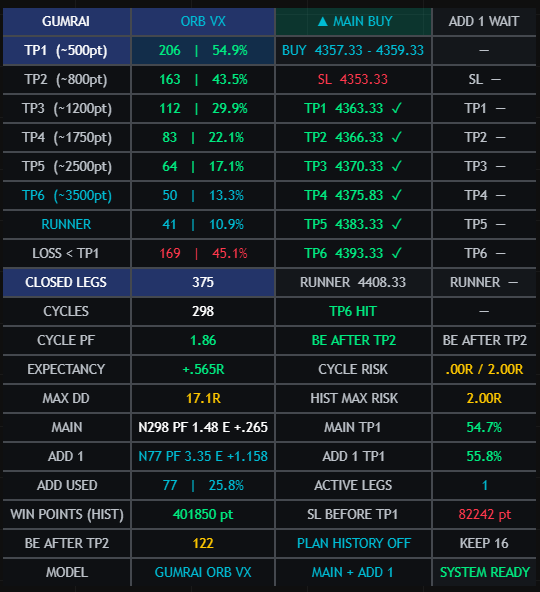
Open full-size imageRead every dashboard row
Understand live MAIN / ADD status and historical model observations
Historical model observations
Current cycle: MAIN and ADD 1
 Open full-size image
Choose a timeframe
Use a timeframe you can monitor and never mix levels across charts
Use a chart above 1 minute
ORB VX shows USE TF > 1m on a 1-minute chart. Choose a supported interval above 1 minute; the supplied example uses 15m.
Keep each chart independent
A MAIN / ADD 1 cycle, targets, and dashboard history belong to that chart interval. Never copy its levels to another timeframe.
Match the alert interval
Create the alert from the same chart and keep the alert interval identical to the chart interval.
Open full-size imageTradingView Alerts and Telegram
Configure Any alert() function call and separate personal from public alerts
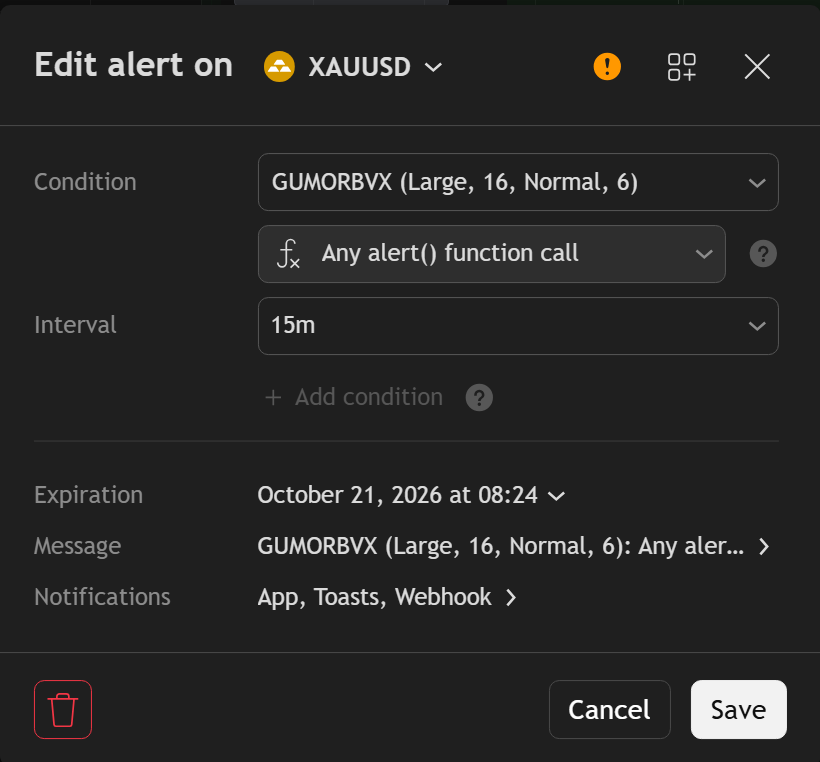
- 01
Open TradingView Alert from the same chart and timeframe you want to monitor.
- 02
Select GUMORBVX as the first Condition.
- 03
Choose “Any alert() function call”. The Pine script controls event frequency internally.
- 04
Keep the alert interval identical to the chart—for example, use 15m for the 15m chart.
- 05
Choose the TradingView notifications you want: App, toast, email, or sound. Webhook is only for a service you own and understand.
- 06
Create a separate alert for every timeframe you actively use.
- 07
After changing indicator settings or receiving a new script version, recreate the relevant alerts so the server snapshot matches.
 Open full-size image
GUMRAI ORB VX • TP2 REACHED • BE ACTIVE MAIN • BUY Entry Zone: 4357.33 - 4359.33 SL: 4353.33 TP1: 4363.33 • TP2: 4366.33 TP3: 4370.33 • TP4: 4375.83 TP5: 4383.33 • TP6: 4393.33 RUNNER: 4408.33
Prices above are only an example of the human-readable layout. Your live alert uses the current leg, direction, and calculated levels.
Your personal TradingView alerts
Created from your own chart and TradingView account. You can receive them through the TradingView app, pop-ups, email, or sound, depending on your account settings.
Gumrai Signals on Telegram
A public channel fed by alerts operated by Gumrai. Joining the channel lets you receive that shared feed; it does not connect your personal TradingView alerts to Telegram.
The product does not currently include personal Telegram delivery. Sending your own TradingView alerts to Telegram requires your own bot and webhook service. Never use or request Gumrai’s private gateway credentials.
Settings to know
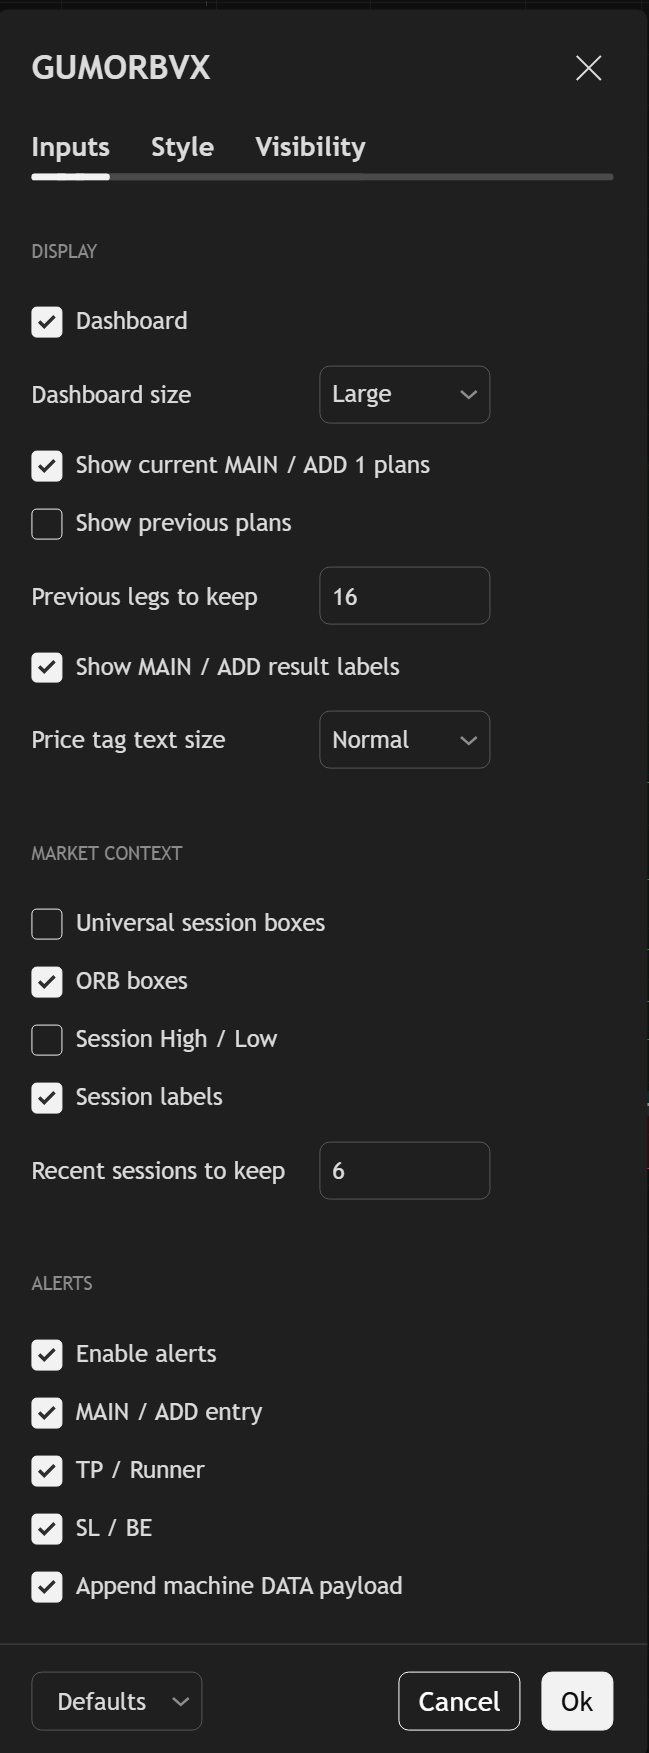
Control dashboard size, price tags, history, context, and alert groups
Dashboard
Show or hide the summary panel. Dashboard size offers five levels; Large is the largest.
Show current MAIN / ADD 1 plans
Keep the active legs, Entry Zones, SLs, targets, and labels visible.
Show previous plans
Retain older plan zones in gray for chart-history review.
Previous legs to keep
Limit how many completed legs remain drawn to reduce chart clutter.
Show MAIN / ADD result labels
Show the ending state for each completed leg.
Price tag text size
Choose one of five text sizes for prices shown in chart labels.
Universal session boxes / ORB boxes
Optional market-context layers; they do not place orders.
Session High / Low and labels
Control session reference levels, labels, and how many recent sessions remain.
Enable alerts
Master switch for Pine alert() events.
Plan preparing
Notify when a gray candidate plan appears and is still waiting for entry confirmation.
MAIN / ADD entry confirmed
Notify separately when the plan changes from gray preparation to an active colored plan.
TP / Runner
Include target and Runner notifications.
SL / BE
Include stop and break-even state notifications.
 Open full-size image
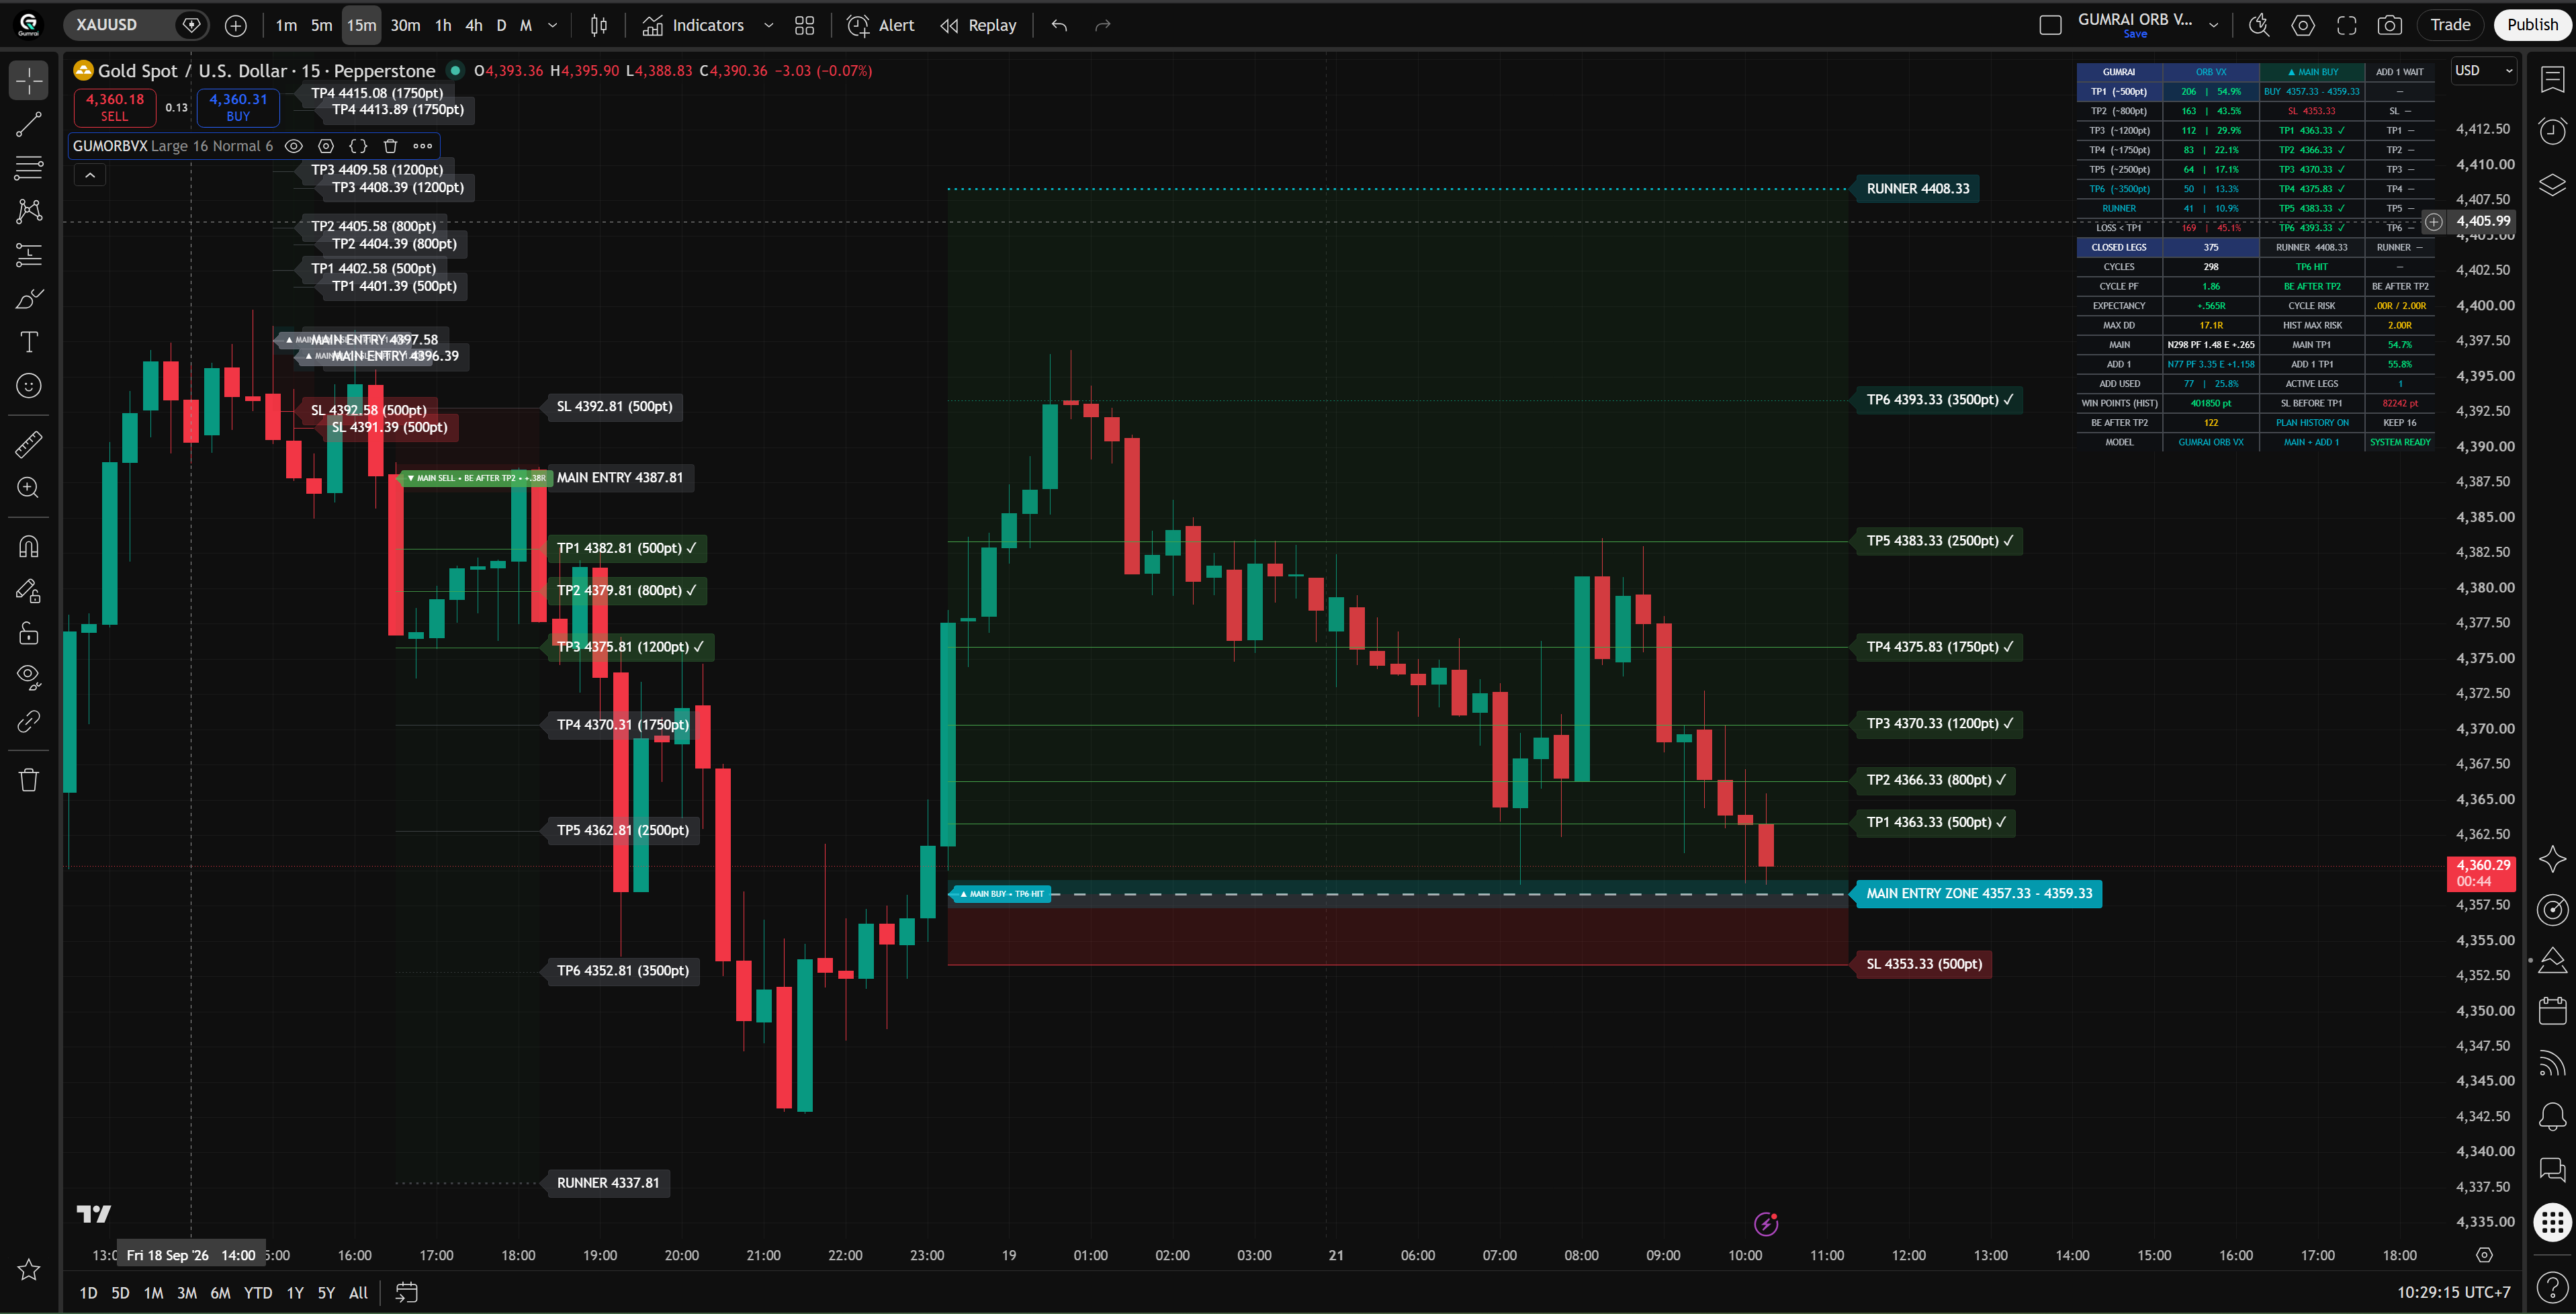
Reading multiple plan outcomes
Review closed legs and the current plan without mistaking them for broker executions
 Open full-size image
How to read the result
Read the closed legs on the left separately from the current MAIN plan on the right. Follow each leg from its Entry label to the last checked target or closing result label.
What the plan represents
These are chart-model observations, not brokerage P&L or proof of a user fill. You remain responsible for every MT4/MT5 order, stop, size, and exit.
Troubleshooting and FAQ
Check access, dashboards, old zones, check marks, and alerts
I cannot find the indicator
Confirm that invite-only access is active for the exact TradingView username and search under Invite-only Scripts.
The dashboard or zones are missing
Open indicator Settings, enable Dashboard and Entry/TP/SL lines, then confirm the supported symbol and timeframe.
Old zones are missing
Enable Show previous plans. Old plans are intentionally gray.
A completed TP has no check mark
Wait for the chart to finish loading, confirm the correct timeframe, and compare the candle high/low with the exact target.
Alerts are missing or too frequent
Check the alert log, condition, and interval. Recreate alerts after a settings or script-version change.
GUMRAI ORB VX
Ready to see the product options?
Review access periods or request a 30-day full-version trial.